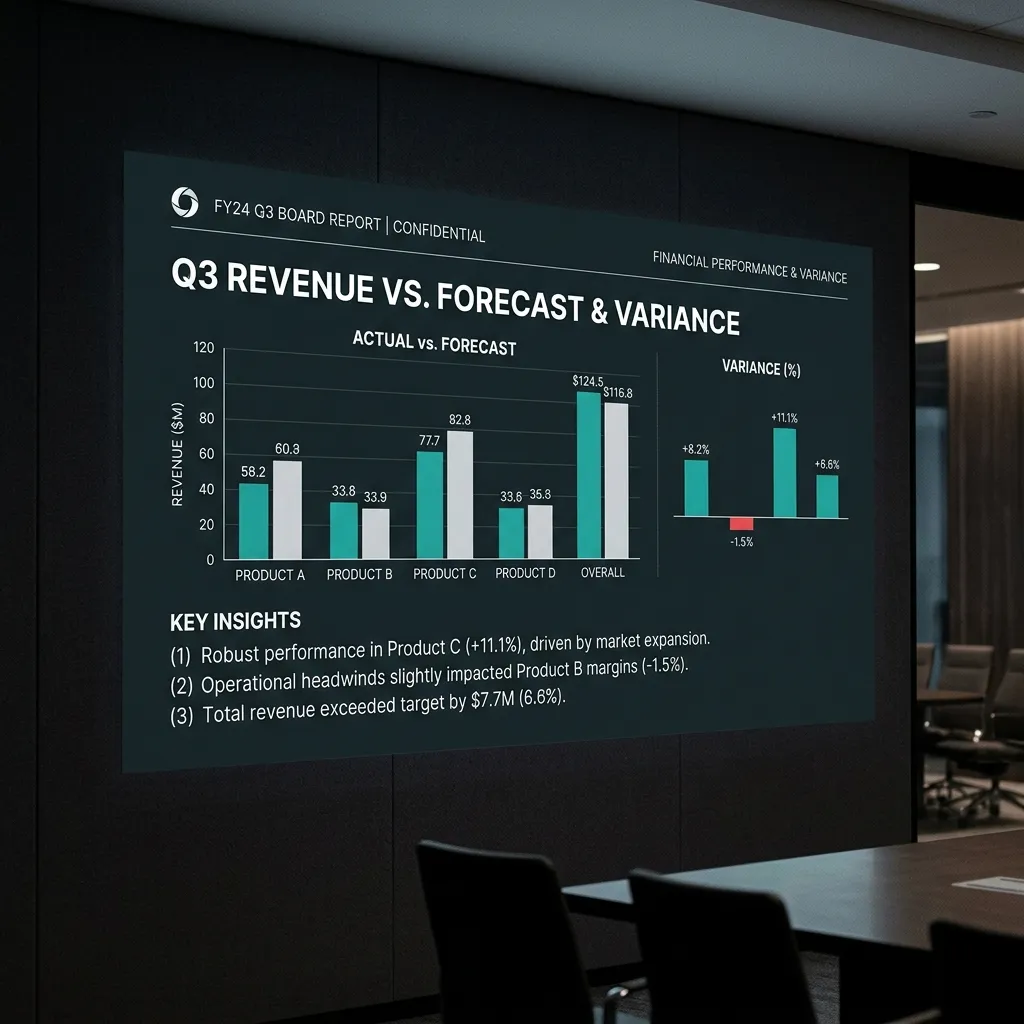

The forecast accuracy formula, MAPE calculation, and benchmark ranges are in the hub article. This article builds the operational system behind those numbers: the submission log, the cause code taxonomy, and the version-to-version review that turns a missed forecast from an event you explain after the fact to an event you anticipated and documented before it closed.
When Variance Has No Evidence Trail
Most B2B SaaS companies produce one version of the forecast per period. It gets committed, reviewed at close, and compared to actual. If it was close, no one investigates. If it was off, leadership reconstructs what happened from memory and CRM timestamps.
That reconstruction is always incomplete. The CRM records deal movement, not forecast logic. If the forecast shifted between two board meetings because a rep reclassified three deals or a definition changed, neither event leaves a trace. The board sees the latest committed number and the actual result. The gap is called variance. The cause of that variance is a story told after the fact, usually by the person whose team was responsible for the number.
51% of CFOs rank forecast accuracy and data quality among their top five priorities for 2026 (Gartner CFO survey, Aug 2025). The constraint most of them face is not that their forecast model is wrong. It is that their forecast has no version history, so every miss requires forensic reconstruction that produces a different account depending on who is doing the reconstruction.
A version log solves that problem before the miss happens.
Why Snapshot Reporting Cannot Explain a Miss
A single forecast snapshot can tell you how far off the number was. It cannot tell you why. Three things that MAPE cannot see are relevant here.
First, it cannot see movement. If the forecast was $4.2M in week one and $3.8M in week eight, the final accuracy calculation compares $3.8M to actual. The week-one version is gone. If the downward movement was caused by one rep pulling two deals from commit to best case, that signal existed seven weeks before close. It does not appear in the accuracy calculation.
Second, it cannot see cause. A timing shift, where a deal moved to next quarter with unchanged buyer intent, looks identical to a pipeline quality problem, where a deal left the forecast because the buyer stopped responding. Both appear as a $400K miss. The cause code is what makes them look different. Without it, the pattern never surfaces.
Third, it cannot see ownership. A board that sees a miss without knowing which part of the organization committed the number cannot distinguish a rep calibration problem from a management roll-up problem from a definition change. The version log assigns an owner to each submission. That is what makes the review attributable rather than diffuse.
The definition article covers what MAPE counts and what it cannot see. This article builds the version log as the required complement: what the formula needs alongside it to be diagnostic rather than just descriptive.
What a Version Log Reveals
A version log does one thing the point-in-time accuracy calculation cannot: it shows how the number moved before it was compared to actual. That movement is often more informative than the final variance.
Three things a version log makes visible are pattern, magnitude, and speed.
Pattern. If the forecast drops in weeks nine and ten of every quarter, that is a late-stage stall pattern. If it drops in weeks two and three, that is a qualification problem. The same size miss, at different points in the quarter cycle, requires a different intervention. The accuracy score does not separate them. The version log does.
Magnitude. A version log showing five $200K incremental moves across the quarter is a different operating problem than one showing a single $1M move in week twelve. Incremental moves suggest rep-level miscalibration accumulating gradually. A single late move usually indicates one deal carried in commit without current buyer confirmation. The cause code for each is different. The fix is different.
Speed. A forecast that drops fast and recovers is timing exposure: a deal pushed one quarter, expected to close in the next. A forecast that drops slowly and does not recover is pipeline quality: the deals that left commit were not genuinely going to close. Speed of movement, visible only in version history, separates the two before the board asks which one it was.
Leading indicators only work as early warning signals when the version log is clean enough to show how prior warnings resolved. A leading indicator flag in week four means nothing if no one can see whether the same flag in the prior quarter preceded a miss or closed cleanly.
How to Build the Forecast Submission Log
The submission log lives outside the CRM. It is not a dashboard view or a custom Salesforce report. It is a controlled record with immutable rows: each version is locked when submitted, and subsequent changes create a new row rather than overwriting the prior one.
The Nine Fields That Make a Version Log Useful
| Field | What It Captures |
|---|---|
| Submission date | When the version was locked. Not when it was discussed. When it was locked. |
| Forecast period | The quarter or month the forecast covers. Q3 2026, not "next quarter." |
| Revenue basis | New ARR, MRR, bookings, or billed revenue. Must be identical across all versions in the same log. |
| Submission point | Week of quarter at time of lock, e.g., Week 4 of 13. This field is what makes the benchmark comparison valid. |
| Total committed | The number the team is committing to for the period. No ranges. One number. |
| Upside | Named deals above commit that could close, with estimated value. Not a probability-weighted average. Named deals the team believes are real but has not committed. |
| Call methodology | How the number was built: bottoms-up rep roll, management override, or model-based. If it changes between versions, that change is itself a signal. |
| Version owner | The named individual who submitted and owns this version. Not the team. One person. |
| Cause code | Assigned to movement from the prior version, not the current one. Why did this version differ from the last? Assigned at submission, not reconstructed afterward. |
The Cause Code Taxonomy
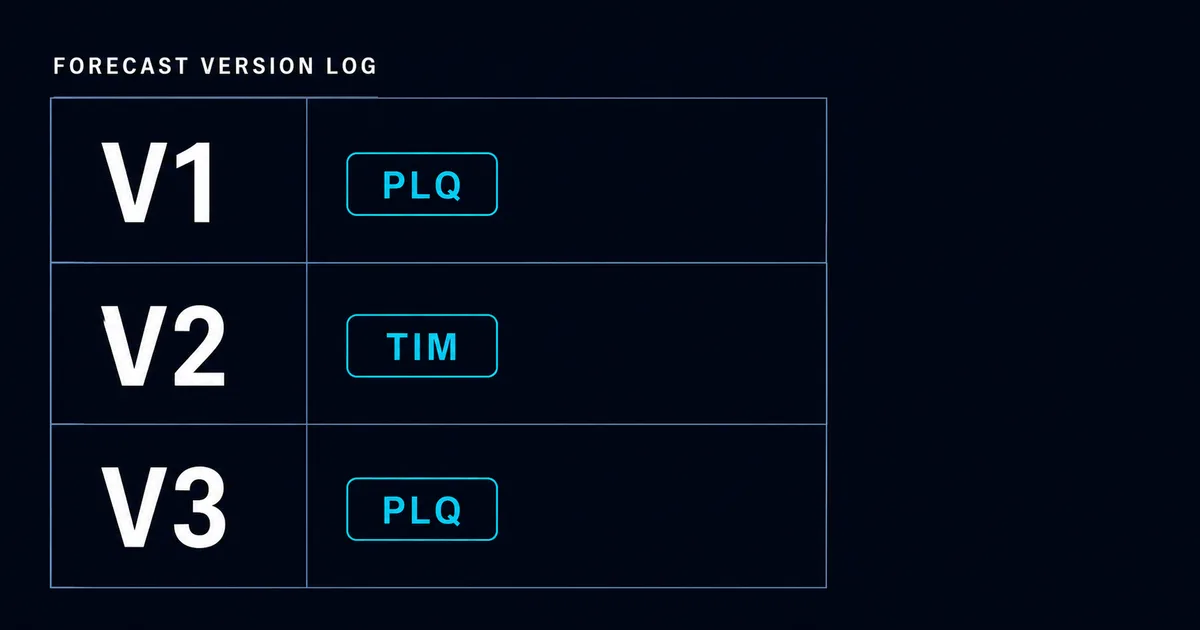
Six codes cover the majority of forecast-to-forecast movement in B2B SaaS. Assign one or more codes at each submission where the committed number changed from the prior version.
| Code | What It Means | Example |
|---|---|---|
| DEF | Definition change | Revenue basis changed from bookings to billed revenue; opportunity count definition narrowed to exclude SQLs without a named economic buyer |
| PLQ | Pipeline quality | Deals moved from commit to best case or dropped because buyer activity stopped or qualification criteria were not met |
| TIM | Timing shift | Deals expected to close this period pushed to next with unchanged buyer intent; procurement or legal review added time after commercial agreement |
| EXT | External market | Deal lost or delayed due to buyer budget freeze, M&A event at the buyer, or a macro-economic condition outside the team's control |
| REP | Rep behavior | Rep recalibration, sandbagging correction, or over-commitment adjustment at the individual deal level |
| MET | Methodology change | Forecast build method changed from bottoms-up rep roll to management override, or stage probability weights were recalibrated mid-quarter |
A single version-to-version movement may carry more than one code if multiple causes contributed. The value of the taxonomy is in the quarterly pattern: if TIM is the dominant code every quarter, the business has a late-stage closing problem. If PLQ is dominant, the pipeline entering each quarter is not genuinely qualified before it is committed to the board.
How to Version Without Rebuilding CRM
The version log does not require a new tool. It requires discipline with an existing one.
The minimum implementation is a spreadsheet with protected rows. Each row is a submitted forecast version. Once a row is written and the version is locked, it is not edited. The next forecast creates a new row. The spreadsheet holds the version history; the CRM holds the deal-level data. They are separate records with different purposes.
For teams already using a revenue forecasting platform, most native tools support version locking and submission logs. Clari, Gong Forecast, Aviso, and similar platforms store historical submissions if the locking feature is enabled and a submission point is defined. The constraint is usually not the tool. It is that no one has turned on the locking feature or assigned a version owner at each submission point. Those are configuration decisions, not implementation projects.
One field that is non-negotiable: the revenue basis must be consistent across all versions. A log that mixes bookings and billed revenue across quarters does not produce comparable rows. The forecast accuracy definition article covers why that single definition choice changes the accuracy score before any comparison is valid. The same applies here: changing the basis mid-log requires a DEF cause code and a note in that version row.
The Cadence
Weekly inside the quarter. Each week's forecast is a new version. The prior week's version is locked. Movement from week to week is assigned a cause code at the time of submission, not reconstructed afterward. A weekly cadence produces 12 to 13 versions per quarter in a standard 90-day quarter. Not all carry material movement. The discipline is in submitting consistently, not in producing meaningful change every week.
Quarterly for board archives. The first-week committed forecast, the final pre-close version, and the actual result are preserved as an immutable set. That three-record set is what a PE sponsor or board audit requires. CRM-to-cash reconciliation relies on the same archived set to trace where the revenue gap opened. Structured forecasting processes with defined submission points achieve 15% higher accuracy than ad hoc approaches (Forrester 2024).
Free Diagnostic
See where your forecast governance breaks down
20 questions. Scored breakdown. The diagnostic identifies whether your forecast problem is definition, version control, calibration, or pressure. Free, ~10 minutes, no call required.
Run the Free Diagnostic →What Good Looks Like: A Three-Period Version History
The table below illustrates what a board-ready quarterly archive looks like. Three periods, cause codes visible, one named owner per period. The numbers are illustrative, modeled on a Series B company with $18M ARR and quarterly new ARR targets around $3.5M.
| Period | Version | Committed ($M) | Actual ($M) | Variance | Cause Code | Owner |
|---|---|---|---|---|---|---|
| Q1 2026 | v1 (Wk 4) | 3.40 | - | - | - | CFO |
| Q1 2026 | v6 (Wk 10) | 3.10 | - | -8.8% vs v1 | TIM, PLQ | VP Sales |
| Q1 2026 | Actual | - | 2.95 | -4.8% vs v6 | - | - |
| Q2 2026 | v1 (Wk 4) | 3.60 | - | - | - | CFO |
| Q2 2026 | v5 (Wk 9) | 3.45 | - | -4.2% vs v1 | PLQ | VP Sales |
| Q2 2026 | Actual | - | 3.42 | -0.9% vs v5 | - | - |
| Q3 2026 | v1 (Wk 4) | 3.85 | - | - | - | CFO |
| Q3 2026 | v3 (Wk 8) | 3.70 | - | -3.9% vs v1 | TIM | VP Sales |
| Q3 2026 | v6 (Wk 12) | 3.55 | - | -4.1% vs v3 | PLQ | VP Sales |
What the board sees in this record: Q1 had two late-quarter adjustments coded and attributed to named owners, and still finished within 5% of the v6 committed number. Q2's PLQ-coded mid-quarter adjustment preceded a close within 1% of v5. Q3 shows a TIM code followed by a PLQ code, both in-quarter, with the result still open. The board can see that PLQ-coded adjustments have preceded near-target closes in both prior periods, which is evidence that the qualification signal is working as a leading indicator rather than as a post-hoc rationalization.
That is what explaining forecast variance to the board requires: not a narrative constructed after the miss, but a record that makes the movement legible before anyone asks. A board-defensible forecast is one where the version history answers the board's questions before they are raised.
The Version-to-Version Variance Review
The review runs in the same cadence as the forecast submission: weekly inside the quarter, quarterly for board archives.
The weekly review has three questions at each session:
- What changed from last week's version? Express it in dollars and as a percentage of the committed number.
- What cause code applies to the movement? The owner assigns the code at the time of review, not after the quarter closes.
- Is this a one-period event (timing exposure) or a repeating pattern (structural deficit)?
If the same code appears three weeks in a row, it is a structural signal. TIM codes in three consecutive weekly reviews indicate a closing-motion problem that is not resolving on its own. PLQ codes in three consecutive weeks indicate that deals are entering the quarter already unqualified. Both require a different response than a one-off miss.
The quarterly review uses the full archive. Compare v1 to v-final to actual across the last three quarters. Look for systematic bias: does the company always over-commit in v1 relative to the final version? That is a calibration problem. Does the final version always predict actual within 5%? That indicates the weekly cause code process is working. Look at which codes dominate: if TIM is the only code across three quarters, the product has a late-stage closing problem. If PLQ is consistent, the ICP or qualification standard is misaligned with the actual buying population.
The HP/HPE context: a structured forecast submission process with weekly versioning and cause code attribution reduced forecast variance from plus or minus 28% to plus or minus 5% within two quarters. The mechanism was not a better model or a new forecasting tool. It was that weekly cause codes forced the team to name the source of movement at the time of movement, which eliminated after-the-fact rationalization and focused the intervention on the correct cause. Observed outcome. HP/HPE engagement.
What to Do First This Week
Set up the log before the end of the current week. One spreadsheet, one named owner, nine fields.
The first version does not need to be perfect. It needs to be locked. Submit the current committed number, name the version owner, and write down the cause codes for any movement that has already occurred this quarter. Use the six-code taxonomy. Approximation is acceptable in week one. Absence is not recoverable after the quarter closes.
At the end of next week, create a new row. Do not edit the first row. Assign the cause code for the movement between the two submissions at the time of submission. That is the start of the audit trail.
If the business is in week ten or eleven of the quarter, start the log now with a note that prior versions were not captured. The quarterly archive for this period will show one version and an actual. That is better than no record. The pattern builds from the next quarter forward.
Run a Forecast Integrity Diagnostic
MxM Revenue Engineering uses the submission log and cause code taxonomy as the starting point for every forecast integrity engagement at B2B SaaS companies between $5M and $50M ARR. If version history is absent, the diagnostic cannot isolate whether a forecast problem is calibration, definition, pipeline quality, or timing exposure.
Book a Call →