
The forecast accuracy formula, MAPE calculation, and benchmark ranges are in the hub article. This article covers what the formula is counting, what it cannot see, and how each definition error produces a leading signal before the miss.
The Definition Problem
Most B2B SaaS companies learn they have a forecast accuracy problem the same way: a forecast miss, a board question, or a lender asking why collections lag bookings. At that point, the natural response is to calculate the metric. Pull the forecasted number. Compare it to actual. Compute the percentage.
The formula is not the problem. What the formula is counting is.
Forecast accuracy is four definition choices compressed into one number. The four choices (period, revenue basis, submission point, and whose forecast counts) are defined in the hub article. Two companies can report identical scores while measuring entirely different things.
The definition problem is not academic. It is the reason companies fix the formula and the variance stays the same.
What the Metric Counts
The standard formula, Accuracy% = 100 minus the absolute percentage error, counts one thing: the magnitude of variance between a committed number and actual results for a defined period.
The full formula, MAPE calculation, and when to use WMAPE are covered in the hub article. This article is not about the math. It is about what the math is operating against.
The metric counts:
- Magnitude of variance. How far the number was from actual, on average.
- Variance across periods. When you compute MAPE, it averages the absolute error rate across measurement windows.
Both are useful signals. But the metric counts nothing else. Direction, timing, deal composition, and cause are all invisible inside the accuracy figure.
What the Metric Does Not Count
These are the four things MAPE cannot see.
Direction. Over-forecasting and under-forecasting produce identical accuracy figures. A team that consistently commits 10% above actual and a team that consistently misses 10% below actual show the same MAPE. Directional bias signals a calibration problem. The metric does not distinguish it from deal-timing noise.
Submission timing. A forecast locked one day before quarter close will almost always look more accurate than one locked eight weeks before. Most teams report accuracy without stating when the number was locked. A submission point of week 12 of 12 is not a forecast. It is a revenue recognition preview. The benchmark requires knowing when the number was committed.
Deal composition. Five deals with equal variance produce the same MAPE as one large deal with high variance and four small ones with none. A company with high average contract value and low deal count will show more volatile MAPE for structural reasons, not process reasons. The metric does not separate deal-concentration risk from forecasting process failure.
Predictability. A deal that slipped because procurement went silent for three weeks and a deal that slipped because the rep over-committed both count the same inside MAPE. One was a process failure. The other was information latency. Cause codes separate them.
Two Companies, Same Score, Different Problem
Two companies at identical MAPE can require opposite interventions. Same score, different root cause, different fix.
Company A. $9M ARR, Series A. Sells enterprise software with three to five deals per quarter averaging $600K ACV. MAPE is 16%. Last quarter, one deal slipped when a procurement committee delayed sign-off by six weeks. That single slip drove the entire variance. The other four deals closed within 5%.
Company B. $10M ARR, Series A. Sells SMB software with 35 deals per quarter averaging $90K ACV. MAPE is 16%. Last quarter, 24 of 35 deals closed below forecast by an average of 20%. Every rep had committed deals above their historical close rate. The forecast was built on optimism embedded in stage probability definitions that had not been recalibrated in two years.
Company A has a deal-concentration problem. One deal moved MAPE by 16 points. The fix is coverage discipline and qualification depth on the largest deals. The stage-exit controls that would have caught the procurement slip earlier are the intervention.
Company B has a calibration problem. Stage probabilities do not reflect historical close rates. Every committed deal carries systematic optimism. The fix is probability recalibration against actual close history, and pressure-driven forecasting is almost certainly amplifying it.
The MAPE figure tells you nothing about which company you are. The cause-coded deal review does.
How Definition Choice Changes the Benchmark
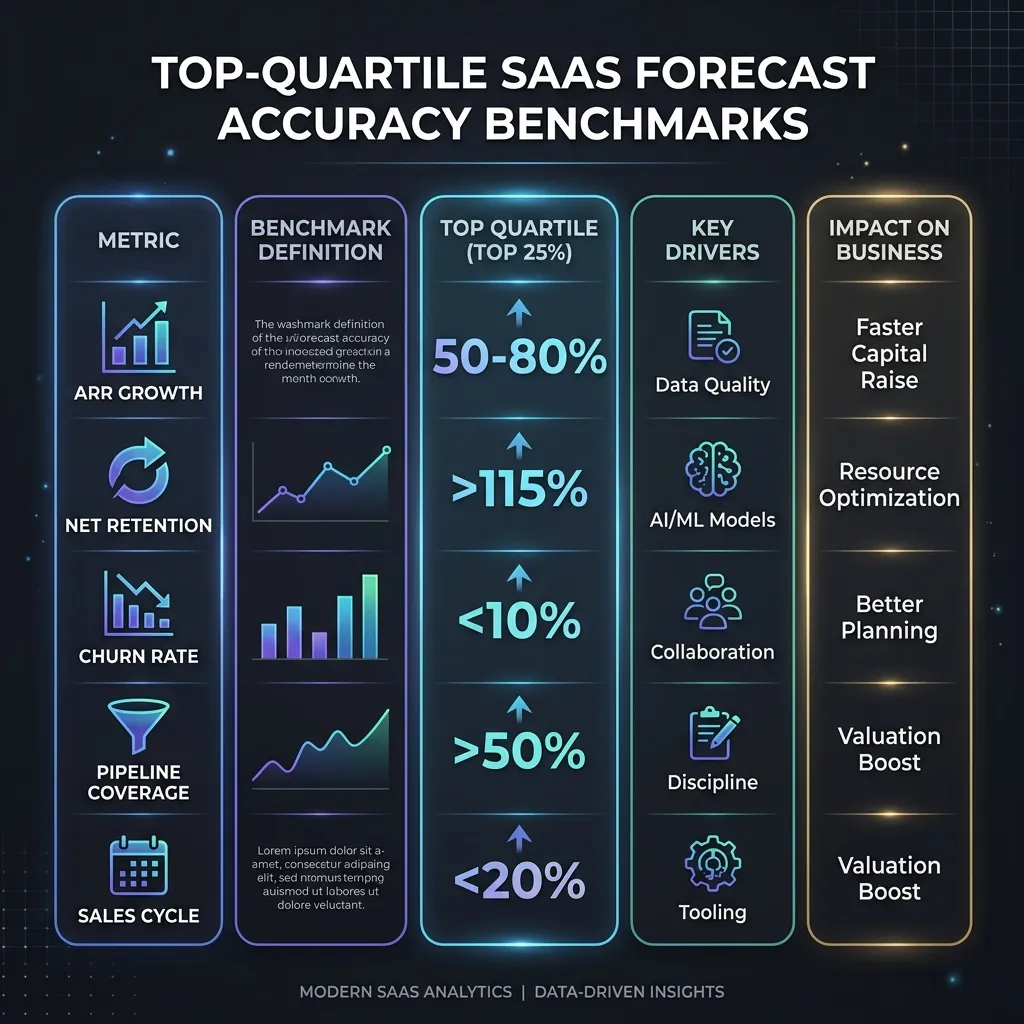
The benchmark ranges most boards use, plus or minus 5-10% for elite, plus or minus 10-15% for good, plus or minus 15-25% for average, assume new ARR bookings measured at a consistent submission point. Those benchmarks shift when the definition shifts.
Billed revenue accuracy is smoother than bookings accuracy. Billing lag smooths lumpy closes because invoices often arrive weeks after the CRM booking date. A company measuring billed revenue accuracy at 89% may have new bookings accuracy at 81%, both from the same operating reality.
Cash collected accuracy is the furthest from the levers the sales team controls. High cash collection accuracy can coexist with a serious collections lag that is invisible in both the pipeline and the board deck. The CRM-to-bank reconciliation is what catches that lag before the board does.
Stage-specific benchmarks differ significantly. At Series A and B, deal count is often too low to produce stable MAPE without variance from deal composition. The board-defensible target at that stage is not a single number. It is consistent explainability of movement, which is a different operating discipline than hitting a specific percentage. For Series B and C board expectations, see the stage-specific benchmark page.
The benchmark is only useful when the definition matches. Comparing your number against the industry range without stating the definition is a numbers exercise, not a diagnostic.
One Diagnostic Signal Per Definition Error
Each unresolved definition produces a leading signal, visible before the miss, not after.
Period not defined. Monthly accuracy and quarterly accuracy produce different numbers from the same data. Signal: your team reports different accuracy figures depending on who asks and over what window.
Revenue basis not defined. Signal: Finance and Sales report different accuracy figures for the same period. Finance is measuring billed or collected revenue. Sales is measuring bookings. Both are correct. Neither knows the other definition.
Submission point not defined. Signal: accuracy looks better every time it is calculated closer to quarter end. The number gets reported as if it represents the full-quarter forecast, but the actual lock date crept forward over three quarters.
Rep versus team aggregation not defined. Signal: individual rep accuracy is 20 or more points below the manager roll-up. The roll-up is obscuring individual calibration problems. A board-defensible forecast requires accuracy traceable to the rep level, not just the aggregate.
When two or more of these signals appear together, the forecast does not have an accuracy problem. It has a definition problem that is producing the accuracy reading.