This case study describes a $22M ARR Series B B2B SaaS company that reduced quarterly forecast variance from 28% to 7% over two quarters by installing stage-exit controls and a formal commit definition. Details are anonymized. Financial figures are rounded.
The Situation
The CEO stopped using the forecast to make decisions after the third consecutive quarter ended with a miss above 20%. The organization ran planning scenarios instead: what can we do if we hit 70% of the number? What if we hit 90%? A Series C raise planned 6 to 8 months out meant that behavior could not continue into investor diligence.
The VP of Sales managed a 9-person AE team. Pipeline reviews ran 2.5 hours per week. The forecast moved materially between submissions. No one in the organization shared a definition of what the committed number meant or what evidence sat behind it.
What the Revenue Integrity Scorecard Found
Four structural problems were identified. None required new tooling. All required process discipline that had never been formalized.
Stage inflation without exit criteria
Stage 3 held 47% of active pipeline by value. When each deal was audited for Stage 3 evidence, 61% had no confirmed next step on the buyer calendar and no mutual action plan. Reps were advancing deals on verbal momentum. The stage label meant "rep believes this is moving" rather than "buyer has taken a verifiable action."
Win rate concentration in low-converting reps
Three of nine AEs had historical win rates below 12%. Their pipeline represented 39% of the total commit number. The remaining six averaged 29%. Blended, the team appeared to run an 18% win rate. The coverage required for the three low-converting reps to make quota was nearly double what the blended number implied. They were structurally set up to miss regardless of effort.
No shared definition of commit
Reps self-selected deals into the commit category. One rep defined commit as "I would be shocked if this does not close." Another defined it as "the buyer said yes verbally." Both were accepted. Neither was useful for forecasting. The commit number meant something different to each person contributing to it.
CRM-to-cash timing lag
Finance recognized revenue an average of 21 days after the CRM showed "closed won." The sales forecast and the finance forecast were measuring different periods. When the board asked why the pipeline review and the revenue report showed different numbers, the answer was a three-week lag that had never been documented or corrected.
The Intervention
Controls were installed in three layers over six weeks, with no new software purchases.
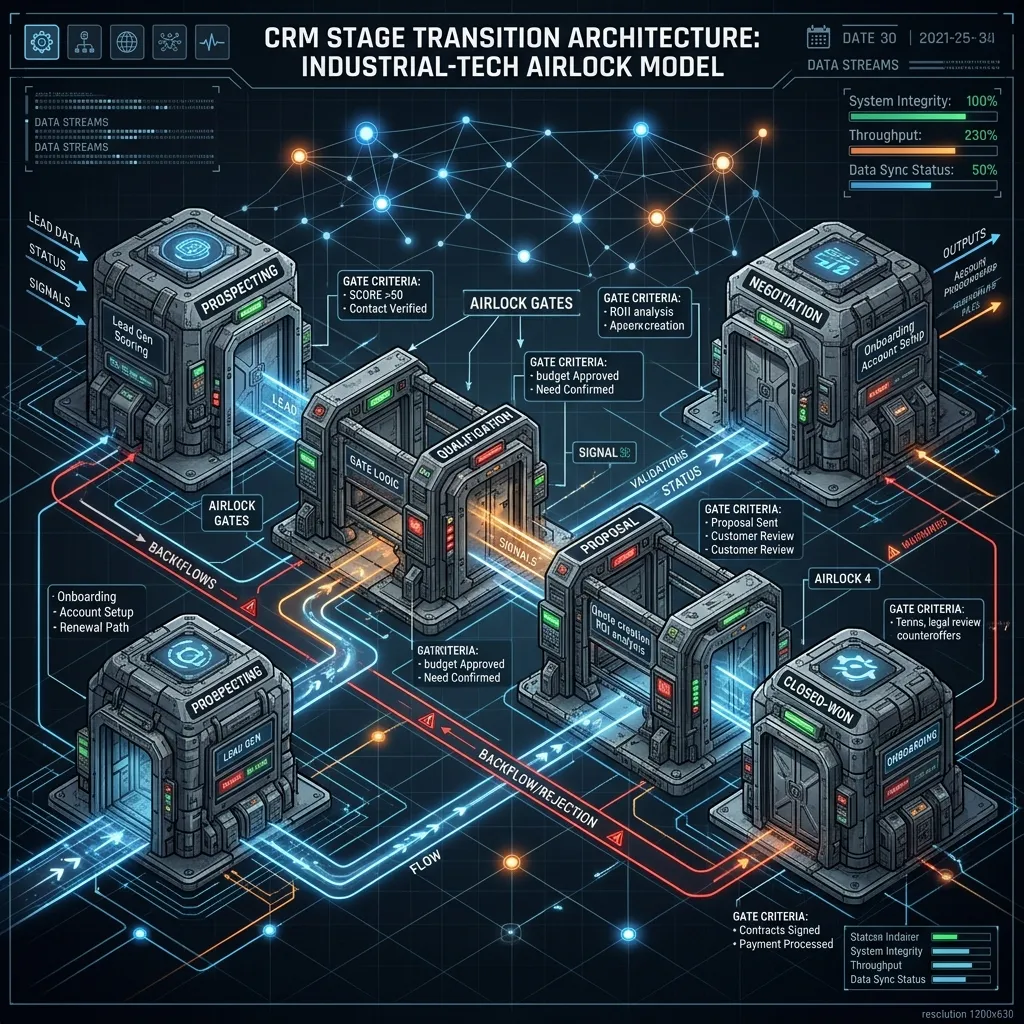
Stage-exit criteria embedded in CRM
Each stage received binary validation rules. Stage 2 required a documented pain statement, a named economic buyer, and a dated next step on the buyer calendar. Stage 3 required a signed mutual action plan, a named legal contact, and a security questionnaire initiated. Stage 4 required written buyer acknowledgment of deal terms and a finance contact introduction. Existing pipeline was audited against the new criteria. Active pipeline fell from $4.8M to $2.9M in two weeks.
Commit definition standardized
A deal could appear in the commit category only if it had cleared Stage 3 exit criteria and carried a close-by date confirmed in writing by the buyer. Self-selected commits were reclassified to best case until criteria were met. The commit number fell 38% in the first week. Two quarters later, the CEO described this as the most important change made.
Weekly variance review cadence
Each manager ran a 15-minute variance check comparing the current week to the prior week. Any movement required a one-sentence explanation logged in the CRM. The explanation requirement removed the practice of quietly adjusting numbers without accountability. Review meetings shortened from 2.5 hours to 45 minutes within the first month.
Quarterly CRM-to-cash reconciliation
A reconciliation was run before each board cycle. CRM closed-won records were matched to finance invoices and payment receipts. Timing gaps were logged and explained. The first reconciliation closed to within 3% of the finance number.
Results
| Metric | Pre-Engagement | Q1 Post-Controls | Q2 Post-Controls |
|---|---|---|---|
| Quarterly Forecast Variance | 28% | 9% | 7% |
| Active Pipeline | $4.8M | $2.9M | $3.1M |
| Team Win Rate | 18% | 22% | 24% |
| Weekly Review Duration | 2.5 hours | 1.2 hours | 45 minutes |
| CRM-to-Finance Lag | 21 days avg | 5 days avg | 3 days avg |
The Series C was raised 7 months after the engagement closed. The lead investor's diligence team ran a pipeline audit as part of the revenue workstream. No material adjustments were required. The investor memo noted pipeline governance as an operating strength.
What Resolved the Resistance
When pipeline shrank from $4.8M to $2.9M, management was uncomfortable presenting a smaller number during a fundraising window. Win rate resolved it within one quarter. A $2.9M pipeline at 22% win rate produces more closed revenue than a $4.8M pipeline at 18%, because the denominator is no longer inflated with deals that were never real. The revenue output was higher even though the pipeline number looked smaller.
When commit became a criterion rather than a sentiment, the VP of Sales could present a number to the CEO with a specific explanation for each deal in it. The CEO could present the same number to the board. The forecast became something the organization stood behind rather than defended.
Revenue Integrity Scorecard
See what your forecast variance is actually costing you
The Scorecard identifies the exact failure points in your forecast system. Completed in one session, returned within two weeks. Used as the foundation for controls installation.
Request the Scorecard →